Forecasting the death of Facebook
05/29/2014
epidemiology, mathematics, python
Recently there was a little mathematical paper written by Cannarella and Spechler (2014) with the title "Epidemiological modelling of online social network dynamics". The basic message of their work is that Facebook will undergo a rapid decline and almost nobody will be interested in it anymore within the next few years. For this unusual statement I started to read the paper myself and implemented the software necessary to reconstruct their results. In the next paragraphs I will try to explain to you the paper with as less advances calculus as possible.
The model
The basic idea behind the mathematical model in the paper is what we call an epidemiology model or SIR model where the letters stand for Susceptibles, Infected and Recovered. In the world of diseases, $S$ represents the number of people who are well but still can get a certain disease, whereas $I$ and $R$ are the number of already ill resp. cured inhabitants.
There are two crucial assumptions behind this model: the disease is not fatal (meaning that no one dies from it) and people are immunized so that once they recover they will not become ill for a second time. The dynamics of the system is thus the following: A fixed fraction $c > 0$ of healthy but still not immunized people from $S$ become ill, meaning they move to group $I$. On the other hand, with a fixed fraction $w > 0$ people recover and become immune, so they move to group $R$.
Let me put this into mathematical terms. The previous ideas give raise to a system of ordinary differential equations. A differential equation is an equation that relates the derivative of a function (that is its rate of change, i.e. how strong it increases of decreases) with the function itself and other functions. For the SIR model we have three functions, namely $S(t)$, $I(t)$ and $R(t)$, where $t$ denotes the time. The model then consist in the following three equations:
$$
\begin{align}
    S'(t) &= -c I(t) S(t) \\
    I'(t) &= c I(t) S(t) - w(t) I(t) \label{eq:I} \\
    R'(t) &= w I(t) \label{eq:R}
\end{align}
$$
Additionally we have to prescribe so called initial values, that is we specify which values the functions should have at time $t = 0$.
So what about social networks?
Okay, we have now introduced (and you have hopefully understood) the SIR model. In the paper this model is related to the growth of social networks with the following analogies: $S$ is the number of people who haven't joint a certain network yet but would in general be willing to do so, whereas $I$ represents the registered users of it and $R$ the ones that either turned their backs on the network or (in contrast to the $S$ people) where not willing to create an account in the first place. With these information we could start to simulate the life cycle of social networks. However, in the paper they use a slight modification of the original model, namely the irSIR model (where the ir stands for infectious recovery). The modification affects the equations $\eqref{eq:I}$ and $\eqref{eq:R}$ that are replaced by the following ones.
$$
\begin{align}
    I'(t) &= c I(t) S(t) - wI(t) R(t) \tag{2a} \\
    R'(t) &= w I(t) R(t) \tag{3a}
\end{align}
$$
The idea behind this modification is to model the effect that people who leave a network might make others do the same (if all your friends leave Facebook it becomes more likely that you will do it, too).
Data acquisition and simulation
So now we have a model at our hands. But with which data do we want to feed it? The easiest way is to retrieve data from Google Trends for some social network. After a few postprocessing steps you can use these data and try to fit the parameters in our model such that $I(t)$ behaves like them. But what are the parameters? If you have a look at the equations you see that there five of them: First of all of course the rates $c$ and $w$, but also some initial values $S(0)$, $I(0)$, $R(0)$, where the dynamics starts. If you want to have a closer look on how to simulate such a system and and find the optimal parameters, you can download the postprocessed data for Facebook and Myspace together with the necessary computer programs from my Github.
Results
First of all the authors considered MySpace for a simple reason: Since almost nobody is using MySpace anymore, its life cycle can be considered somewhat complete which makes it a perfect test case for the irSIR model. Below you see a graph with the results. The blue curve are the postprocessed data from Google Trends. They are normalized such that 100 stands for the overall maximum activity. The red curve is the simulation result of $I(t)$ with the parameters chosen such that the simulation catches the data as good as possible. You see that the dynamics is caught quite well. The green line marks the points where interest in the network drops below 20% of its maximum, which the authors interpret kind of like the death of the network. In this case, MySpace is to be considered dead since last 2010.

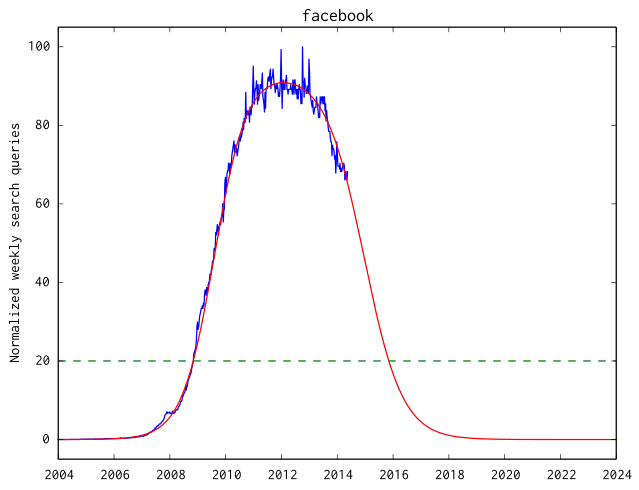
Now for Facebook. This case is more interesting since the network is still alive (the blue curve is still far above the 20% line). Again I carried out a parameter fitting and the resulting best-fit curve is printed in red. You see that the simulation predicts a rapid decent of interest in Facebook in the near future, with the result that interest in the network will drop below 20% of its maximum and thus cease to exist in late 2015.
Conclusion
So how to deal with such results? At the first glance this looks pretty convincing to many people, because there is math involved. But in fact, I would not give too much about it. First, you should question the use of Google Trends for some reasons. Not everyone uses Google as search engine so the data could not be representative. But more important is the fact that in my eyes the amount of search queries containing "Facebook" doesn't relate to the communication happening inside of the network. As long as no one searches for Facebook but still uses it, the network is alive although the model tells a different story. The second - and from a mathematical point of view more severe - objection is the model itself. Fitting curves to data is a nice thing. But using these curves as a measure to predict the future is a delicate task. There is a saying from the famous mathematician John von Neumann who once said: "With four parameters I can fit an elephant, and with five I can make him wiggle his trunk". What he wants to say is that with the right amount of parameters you can explain basically any data with a suitable mathematical model. This leads to the conclusion that our irSIR model might explain the data purely by accident and not because it truly catches the intrinsic behaviour of social networks (indeed, I find that highly questionable). Actually, there may be other mathematical models explaining our Google data as well as the presented one, but with very different predictions for the future.